
You can change the chart's price scale from the toggles at the bottom-right of the chart — %, log, and auto. These control how the price axis is drawn.
Change the price scale
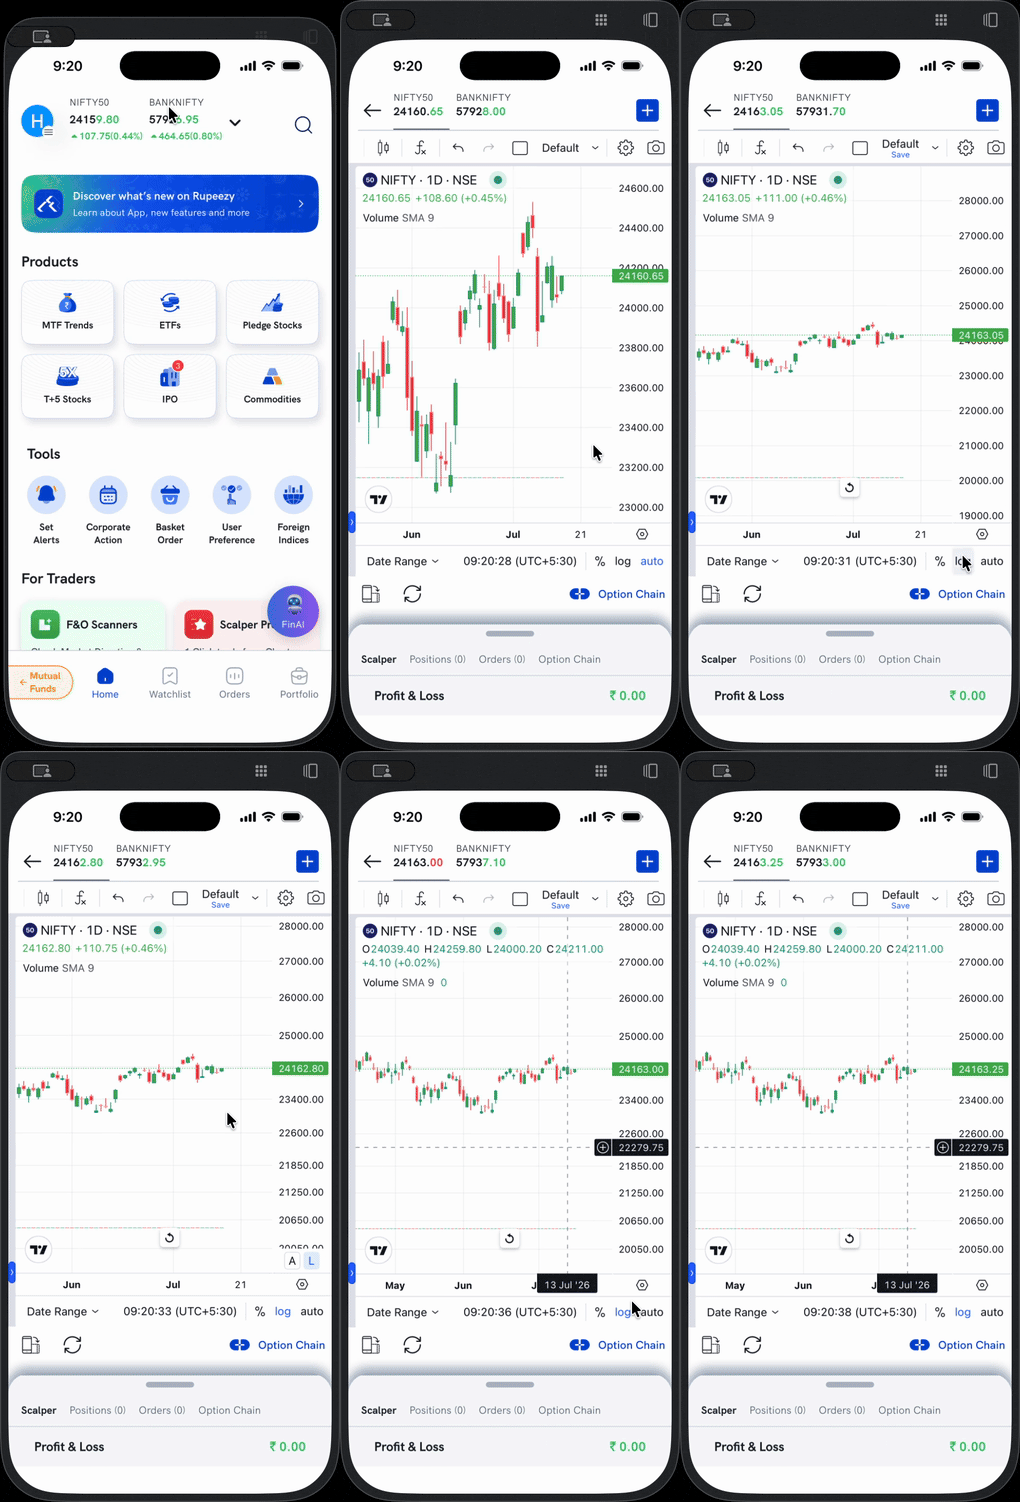
At the bottom-right of the chart you'll see three toggles:
- log — switches the price axis to a logarithmic scale, where equal vertical distances represent equal percentage moves. Useful for long time ranges or fast-growing stocks. Tap it to turn the log scale on or off.
- % — shows the axis as percentage change instead of price.
- auto — auto-fits the price axis to the candles currently in view.
The chart redraws instantly when you tap a toggle.
Good to know
- A regular (linear) scale spaces prices evenly; a log scale spaces them by percentage — the same chart can look quite different between the two.
- You can also use the A (Auto) and L (Log) shortcuts on the price axis itself.