The stock detail screen on the Rupeezy app brings price data, derivatives data, and analysis for any stock or index into one place, so you don't have to switch between tools. This article walks through each tab and what it shows.
How to use the stock detail screen
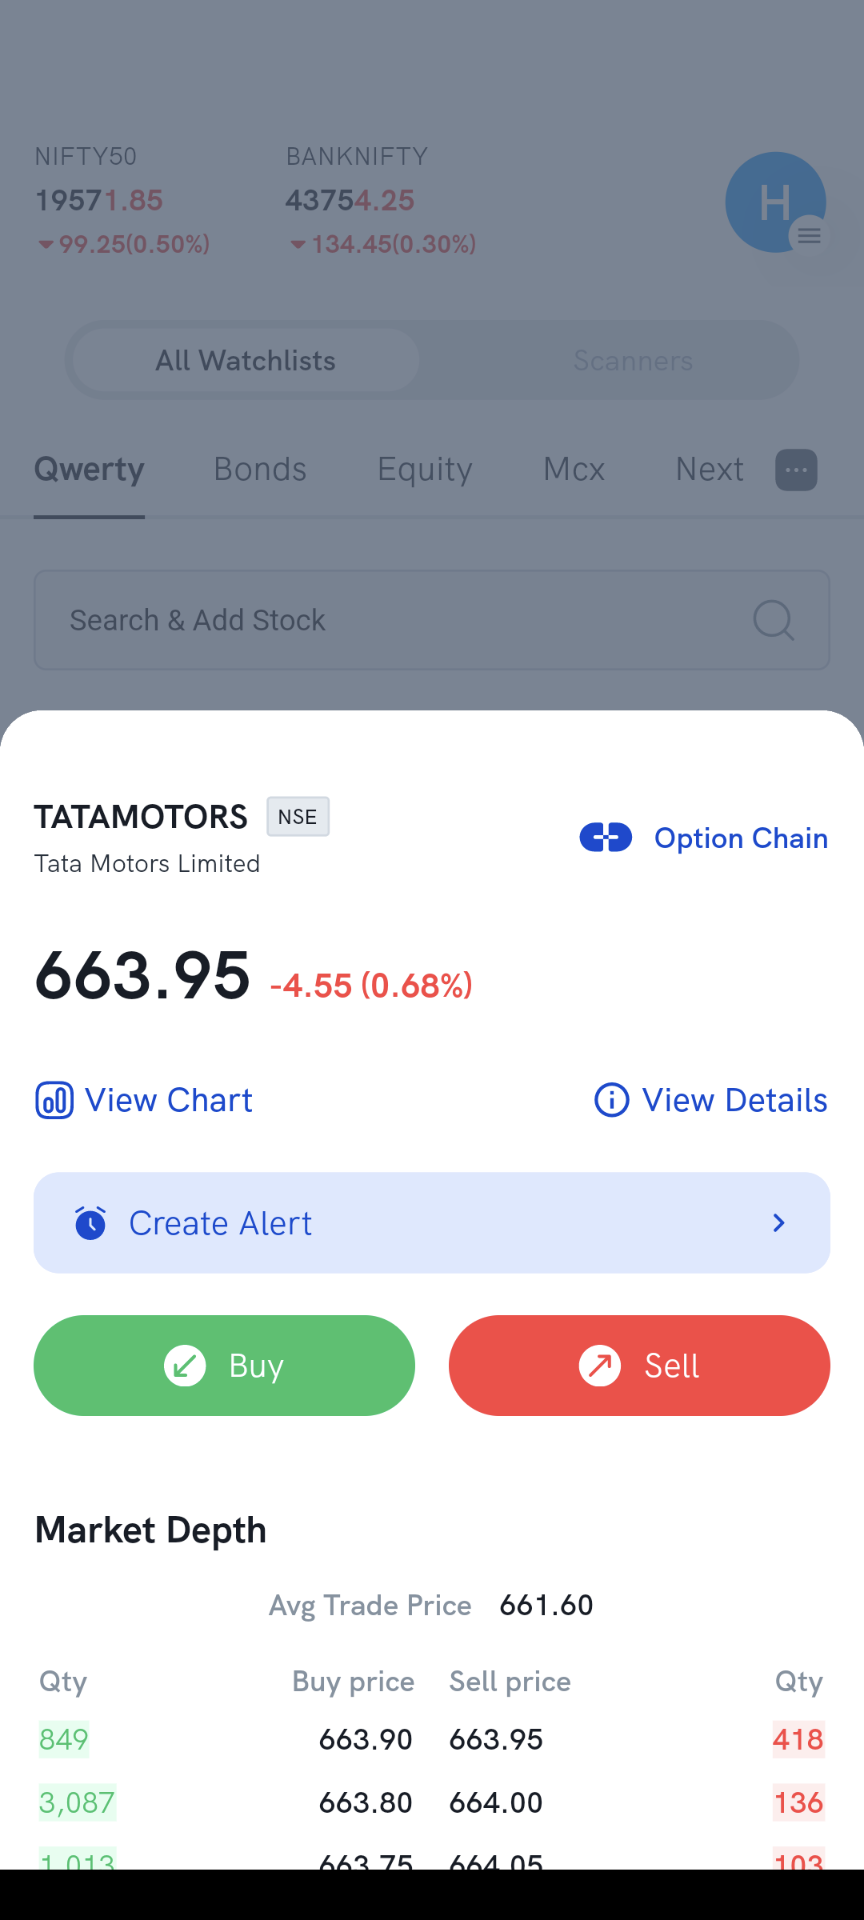
Step 1: Go to the Rupeezy app > tap a stock in your Watchlist > View Details.
It could be a stock or index like Nifty/Banknifty
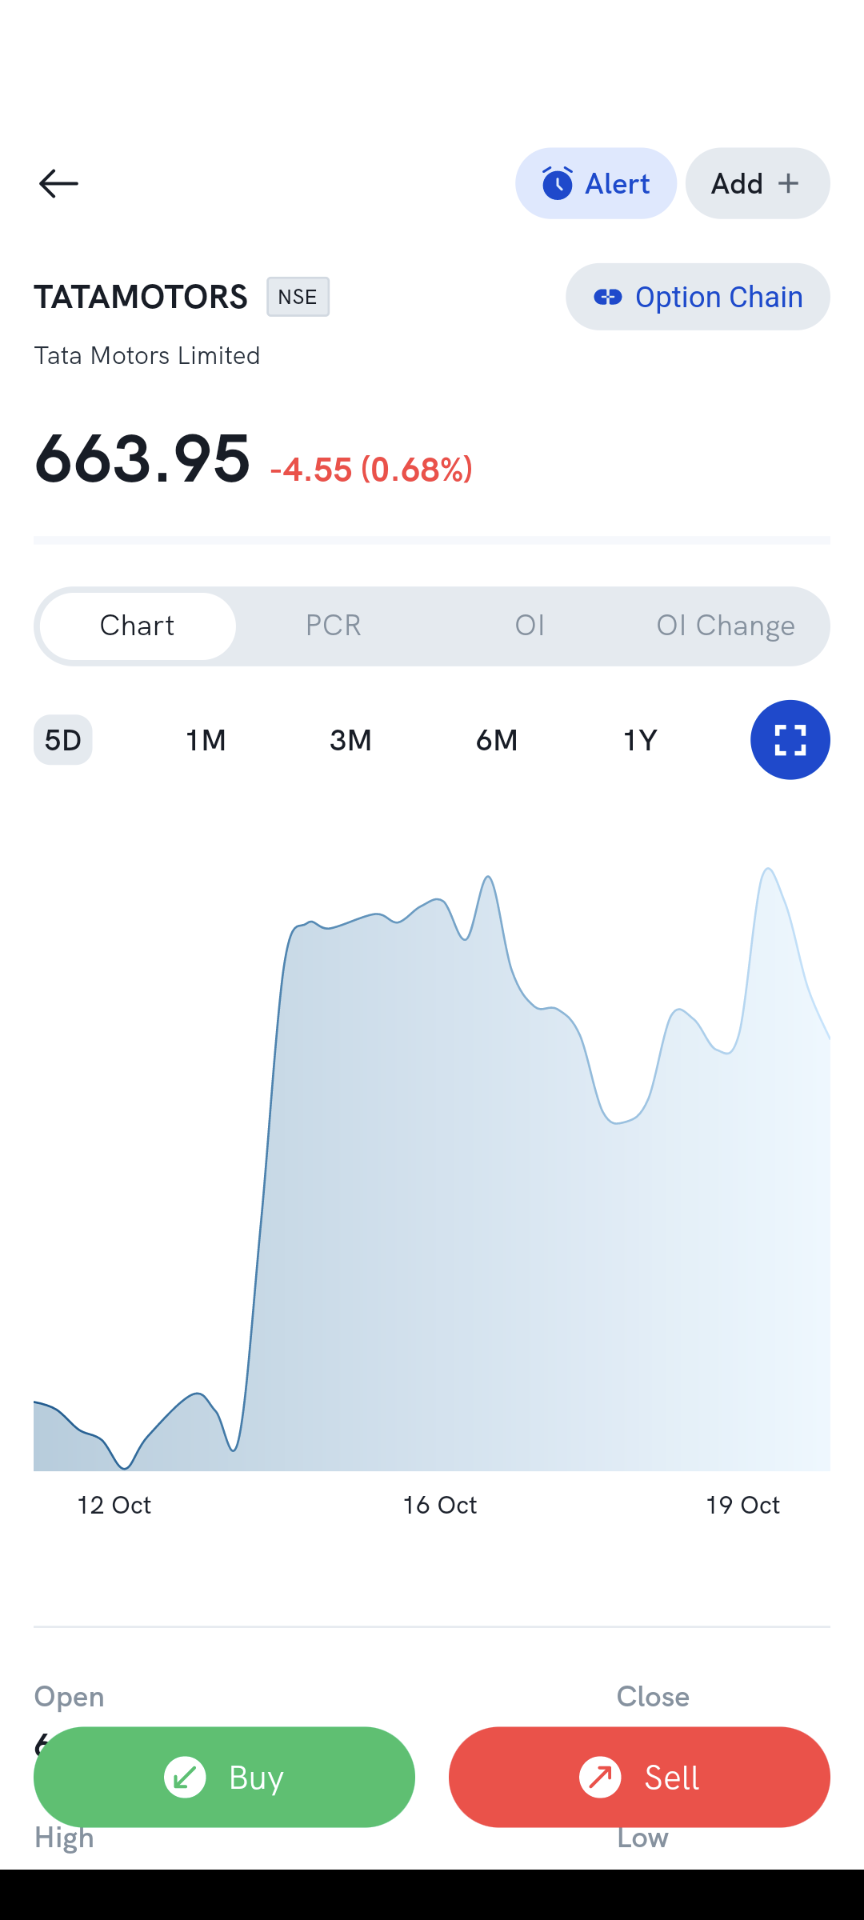
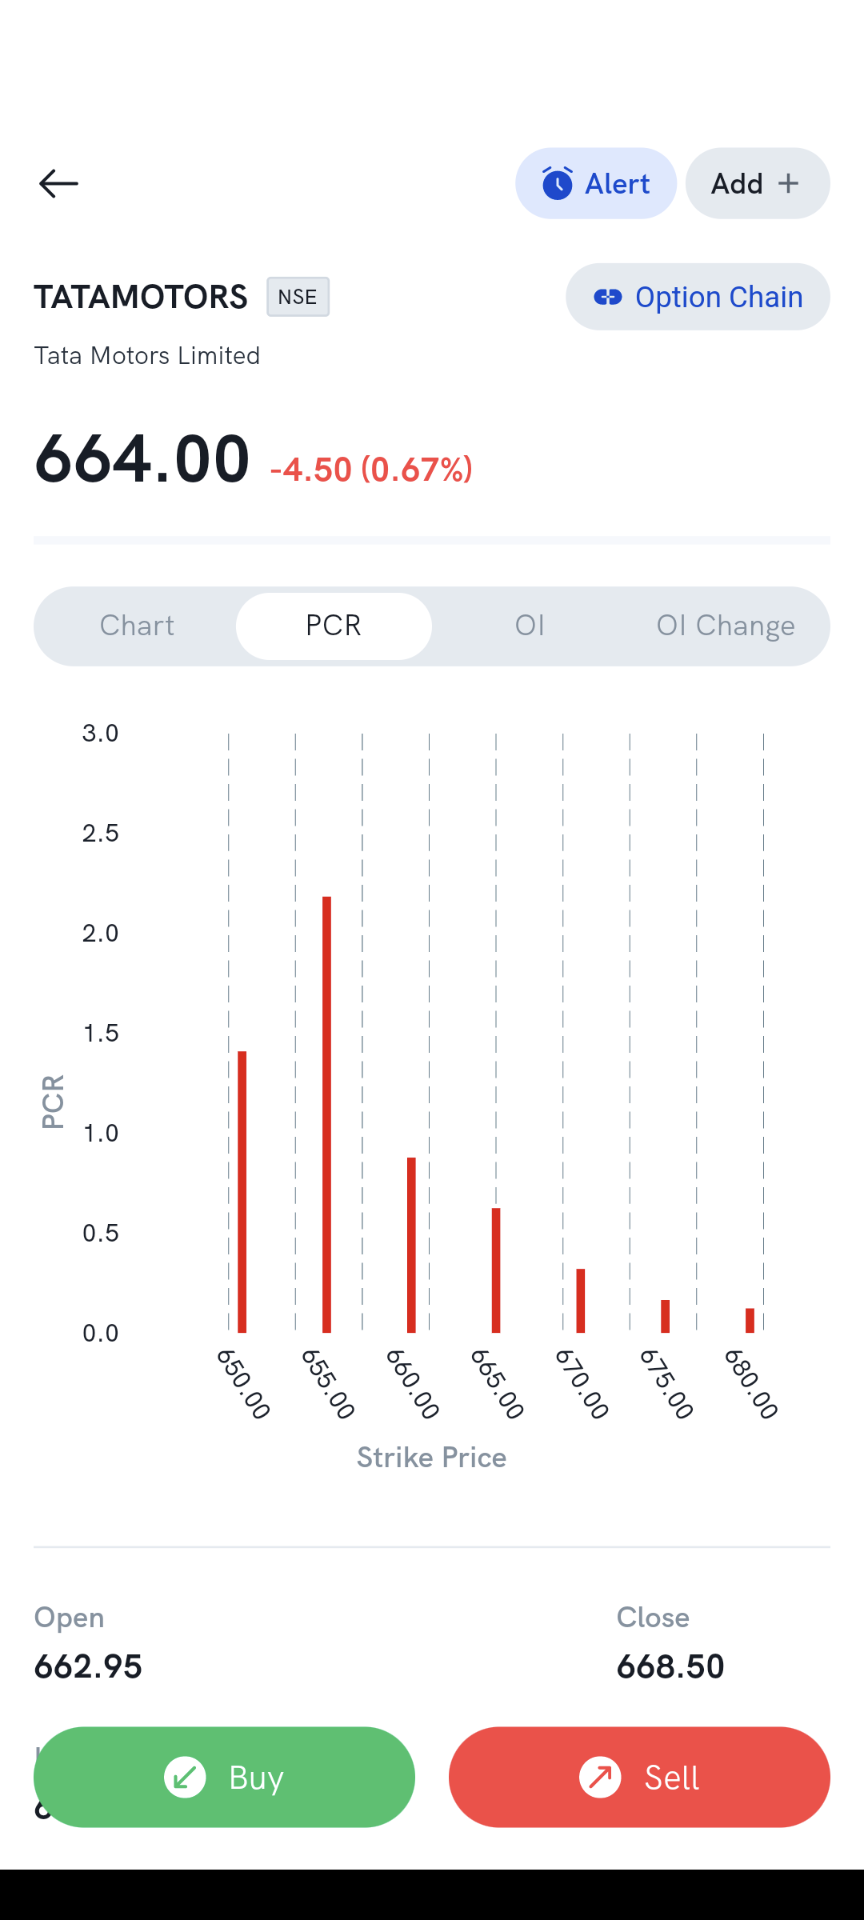
Step 2: Click on the PCR (Put Call ratio) tab below the Price. (To the right of the Chart tab)
The Put Call Ratio (PCR) is an indicator calculated by dividing the number of open put options by the number of open call options at different strike prices. Traders use PCR as an indicator, to recognize bullish or bearish sentiment in the market.
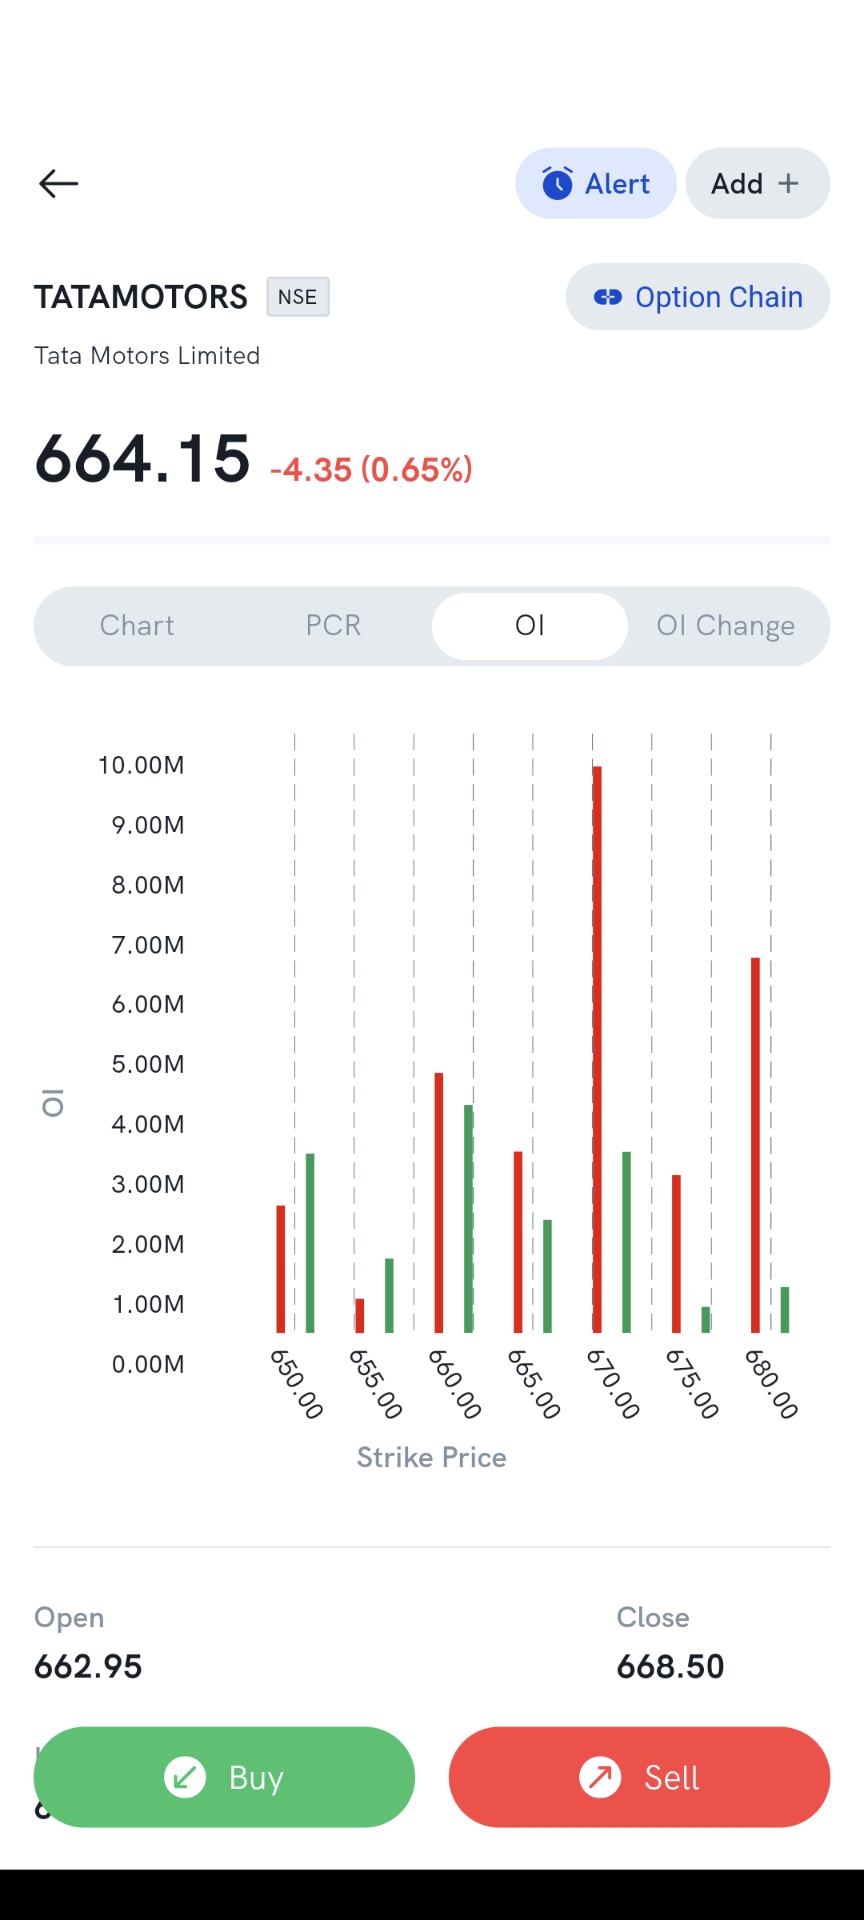
Step 3: Click on the OI Tab on the right of the PCR tab.
Open Interest represents the total number of outstanding derivative contracts like futures and options, that are not settled. For traders, understanding open interest can provide valuable insights into market liquidity, trend strength, and potential price reversals, contributing to better-informed trading decisions.
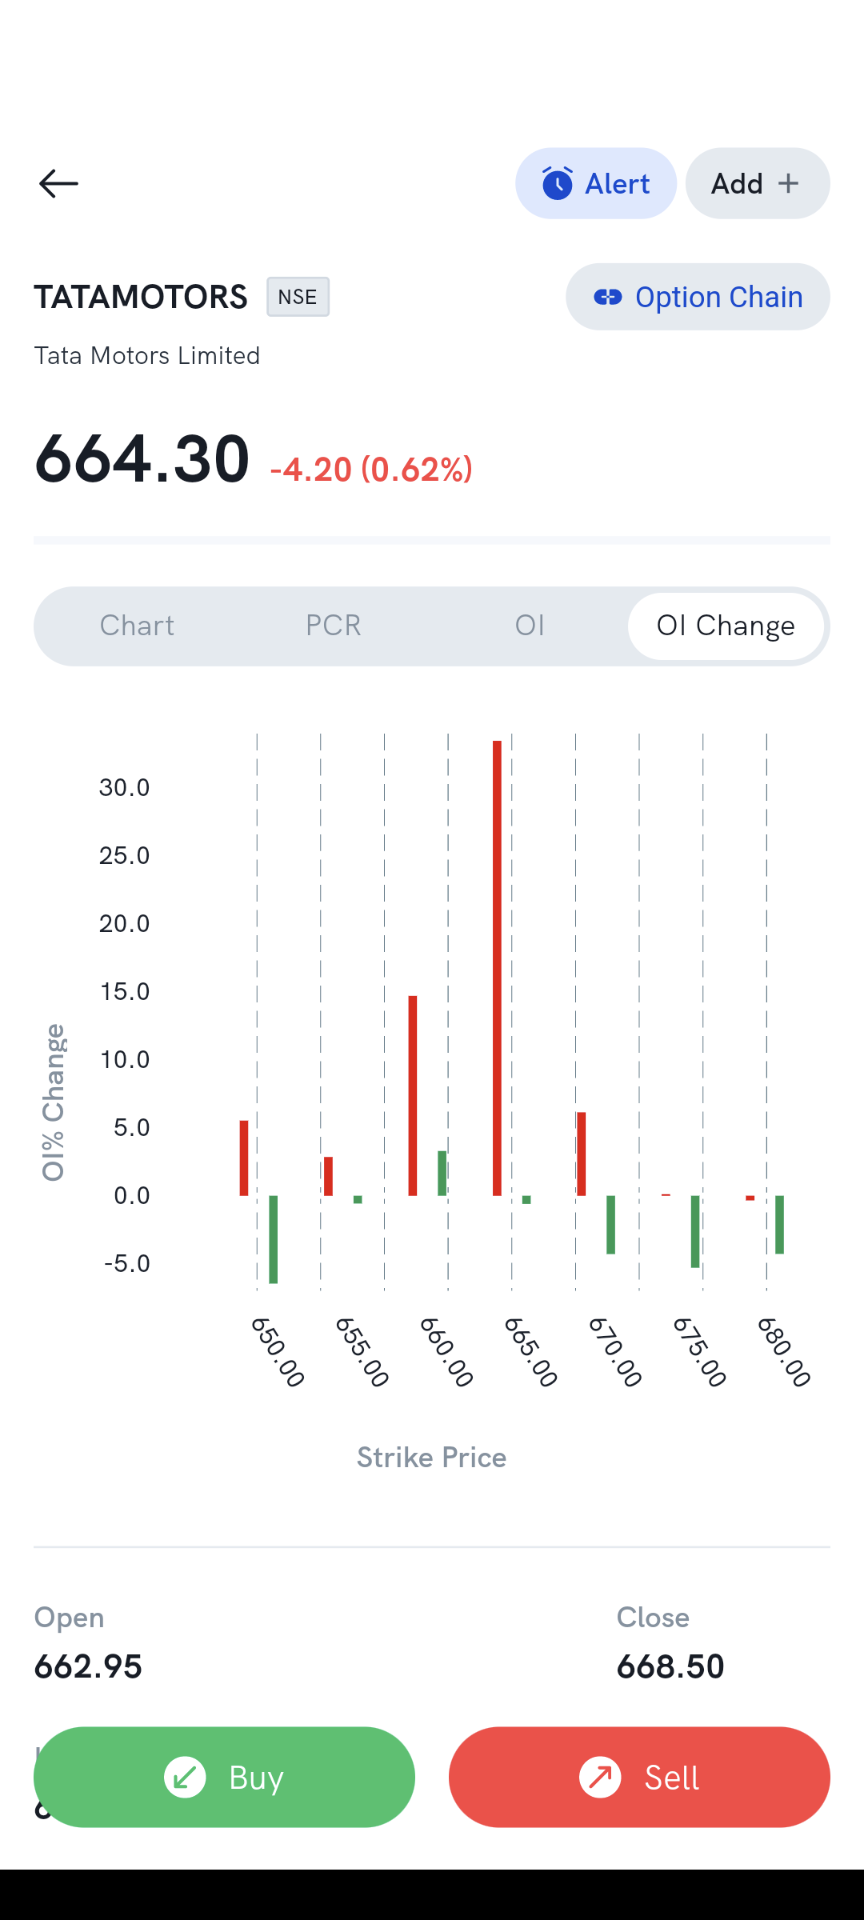
Step 4: Click on the OI Change tab on the right of the OI tab.
Open Interest Change, expressed in percentage terms, reflects the daily net change in open and closed positions for call and put options at a particular strike price. It is displayed for three strike prices each above and below the 'At-The-Money' (ATM) price. Rising OI Change indicates more new positions; falling OI Change shows more closed ones. This data can help predict market trends.
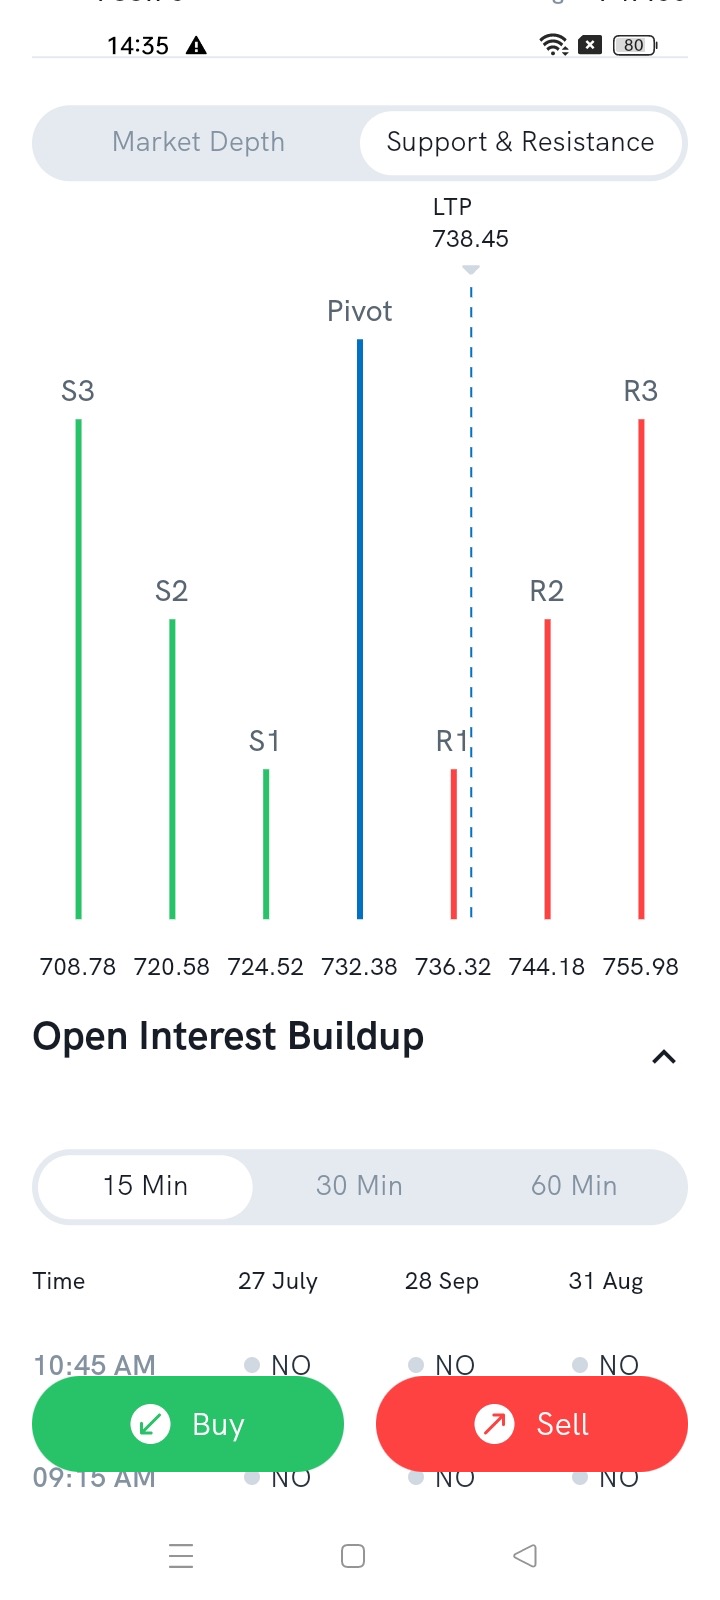
Step 5: Scroll below and click on the Support and Resistance tab on the right of the Market Depth Tab.
We show three support, three resistance levels, and a pivot. The three Support levels are denoted by S1, S2, and S3, and Resistance by R1, R2, and R3. An LTP (Last Traded Price) line is also shown which moves according to its price change. Formulae to calculate Support, Resistance, and Pivot are given below.
Pivot = (Close + High + Low)/3
S1 = (2* Pivot) - High
S2 = Pivot - (High - Low)
S3 = Pivot - 2*(High - Low)
R1 = (2* Pivot) - Low
R2 = Pivot + (High - Low)
R3 = Pivot + 2*(High - Low)
Note: R3 > R2 > R1 > S3 > S2 > S1
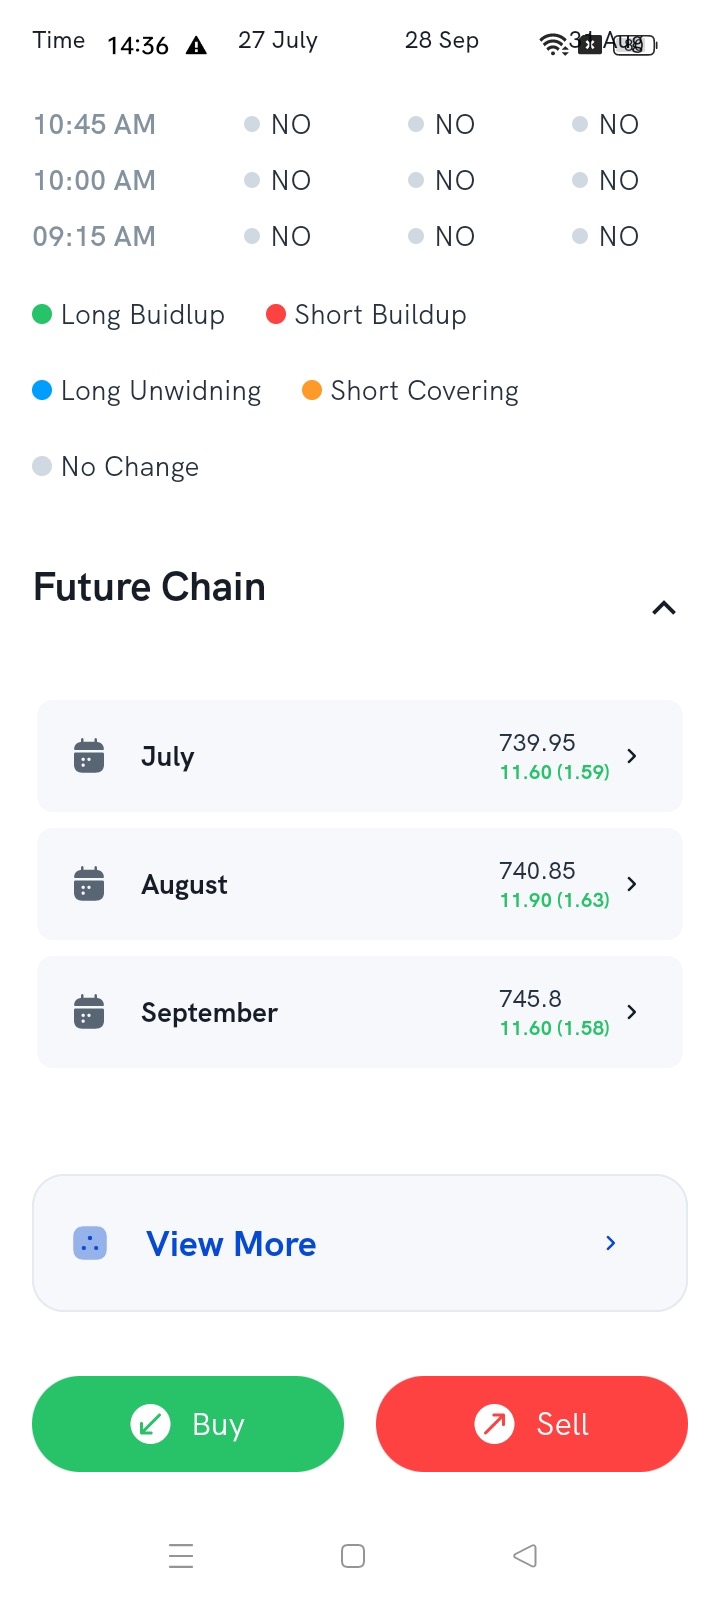
Step 6: Scroll down and you will see Open Interest buildup.
The screen also shows open interest build-up — long build-up, short build-up, long unwinding, and short covering — which can help you read likely price movement.
Users can see the last four buildups of the future contract. An option to change the interval is given for 15 minutes, 30 minutes, and 60 minutes.
| Open Interest | Price | Position |
|---|---|---|
| Increasing | Increasing | Long Buildup |
| Decreasing | Decreasing | Long Unwinding |
| Increasing | Decreasing | Short Buildup |
| Decreasing | Increasing | Short Covering |
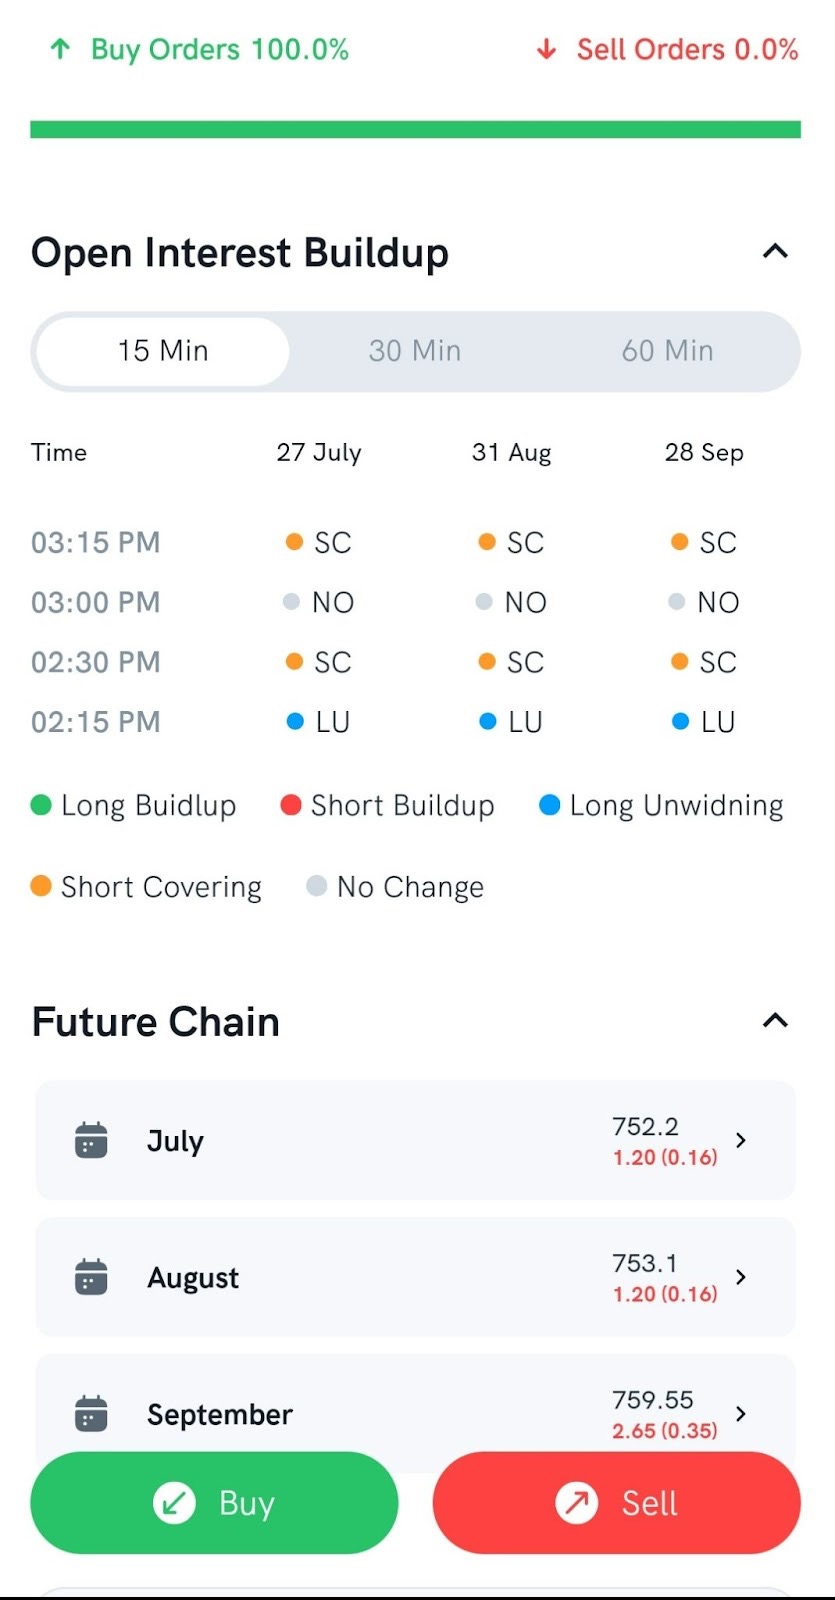
Step 7: Scroll down to find the Future Chain Section.
The Future Chain section on the Rupeezy app shows contract prices for the next three months of expiry, so you can analyse price trends and plan trades.
In the View More section, you can find more information about the stock/index like its Fundamental Data, Financial Data, and Shareholding Pattern.